BDL LAB Documentation
Complete guide to building betting models
Overview
What is BDL Lab?
BDL Lab is a betting model builder by BALLDONTLIE. It allows you to create prediction models by combining pre-built factors, backtest against 6+ years of historical data, and track live predictions for upcoming games.
Key Features
- Factor-based modeling - Combine 15-18 pre-built factors per sport
- Historical backtesting - Test models against data from 2020 to present
- Multiple sports - NBA, NFL, NHL, and MLB supported
- Live predictions - Generate predictions for upcoming games
- API access - Programmatic access for automation and AI agents
Who is it for?
BDL Lab is designed for sports bettors who want a data-driven approach to their betting strategy. Whether you're a casual bettor looking to make more informed decisions or a serious bettor building systematic models, Lab provides the tools you need.
Subscription Tiers
- UI access only
- 1 model limit
- 1 week backtest limit
- No API access
- Full backtest history (2020+)
- API access
- Unlimited models
- Everything in LAB PRO
- BALLDONTLIE Sports API
- Real-time data for 20+ leagues
Getting Started
1. Create an Account
Sign up for free at lab-app.balldontlie.io/signup. You can explore the UI and create models immediately with the free tier.
2. Choose Your Sport
Select from NBA, NFL, NHL, or MLB. Each sport has its own set of factors tailored to that league's unique characteristics.
3. Create Your First Model
- Click Create Model on the Models page
- Select a bet type (Spread, Moneyline, or Over/Under)
- Choose your mode (Simple or Weighted)
- Add factors and assign importance levels
- Click Run Preview to see historical performance
- Save your model when satisfied
4. Backtest and Generate Predictions
After saving, run Run Backtest to get a full historical analysis. Then use Generate Predictions to create predictions for upcoming games.
Core Concepts
Factors
Factors are metrics that predict game outcomes. Each factor has a raw value (the actual metric) and a normalized score (0-100 scale) for comparison across different factors.
There are 5 factor categories:
- Team Performance - Scoring averages, defensive ratings, home/away splits
- Matchup - Head-to-head history, pace differentials
- Situational - Rest days, travel, schedule density
- Player - Star player availability and impact
- Market - Line movement, public betting percentages
Models
Models combine multiple factors with assigned weights to generate predictions. There are two modes:
- Simple Mode - Assign Low/Medium/High importance to each factor. The system converts these to weights automatically.
- Weighted Mode - Assign precise percentage weights that must sum to 100%.
Model Types
- Game Models - Predict game-level outcomes: which team covers the spread, wins outright, or whether the total goes over/under.
- Player Prop Models - Predict individual player stat lines (points, rebounds, assists, steals, blocks, threes) against their prop line. Available for NBA.
Bet Types
- Point Spread - Predict which team covers the spread
- Moneyline - Predict the outright winner
- Over/Under - Predict whether total score goes over or under the line
- Player Prop Over/Under - Predict whether a player's stat line goes over or under the prop line
Evaluation Pipeline
The workflow for using a model:
- Preview - Test configuration before saving (results not persisted)
- Save - Persist the model configuration
- Backtest - Run full historical analysis (results persisted)
- Generate Predictions - Create predictions for upcoming games
Complete Walkthrough
This section walks through a complete example: creating an NBA spread model, running a backtest, interpreting results, and generating predictions. We'll explain every configuration choice along the way.
Step 1: Create the Model
Let's build a model called "NBA Rest & Defense" that focuses on situational advantages and defensive performance—two factors that tend to be undervalued by casual bettors.
Choosing the Sport and Bet Type
We're choosing NBA because basketball has the most games (82 per team) giving us the largest sample size for backtesting. Point spread is ideal because:
- Spreads require a more nuanced edge than moneyline (where heavy favorites offer little value)
- The vig on spreads (-110) is lower than moneyline underdogs
- Our factors (rest, defense) directly impact margin of victory, not just win/loss
 Select your sport to see available factors
Choosing the Mode
We'll use Simple Mode with Low/Medium/High importance levels. This is recommended when:
- You're still learning which factors work best
- You want the system to normalize weights automatically
- You prefer faster iteration over precise control
Weighted Mode (precise percentages) is better once you've identified your core factors through backtesting.
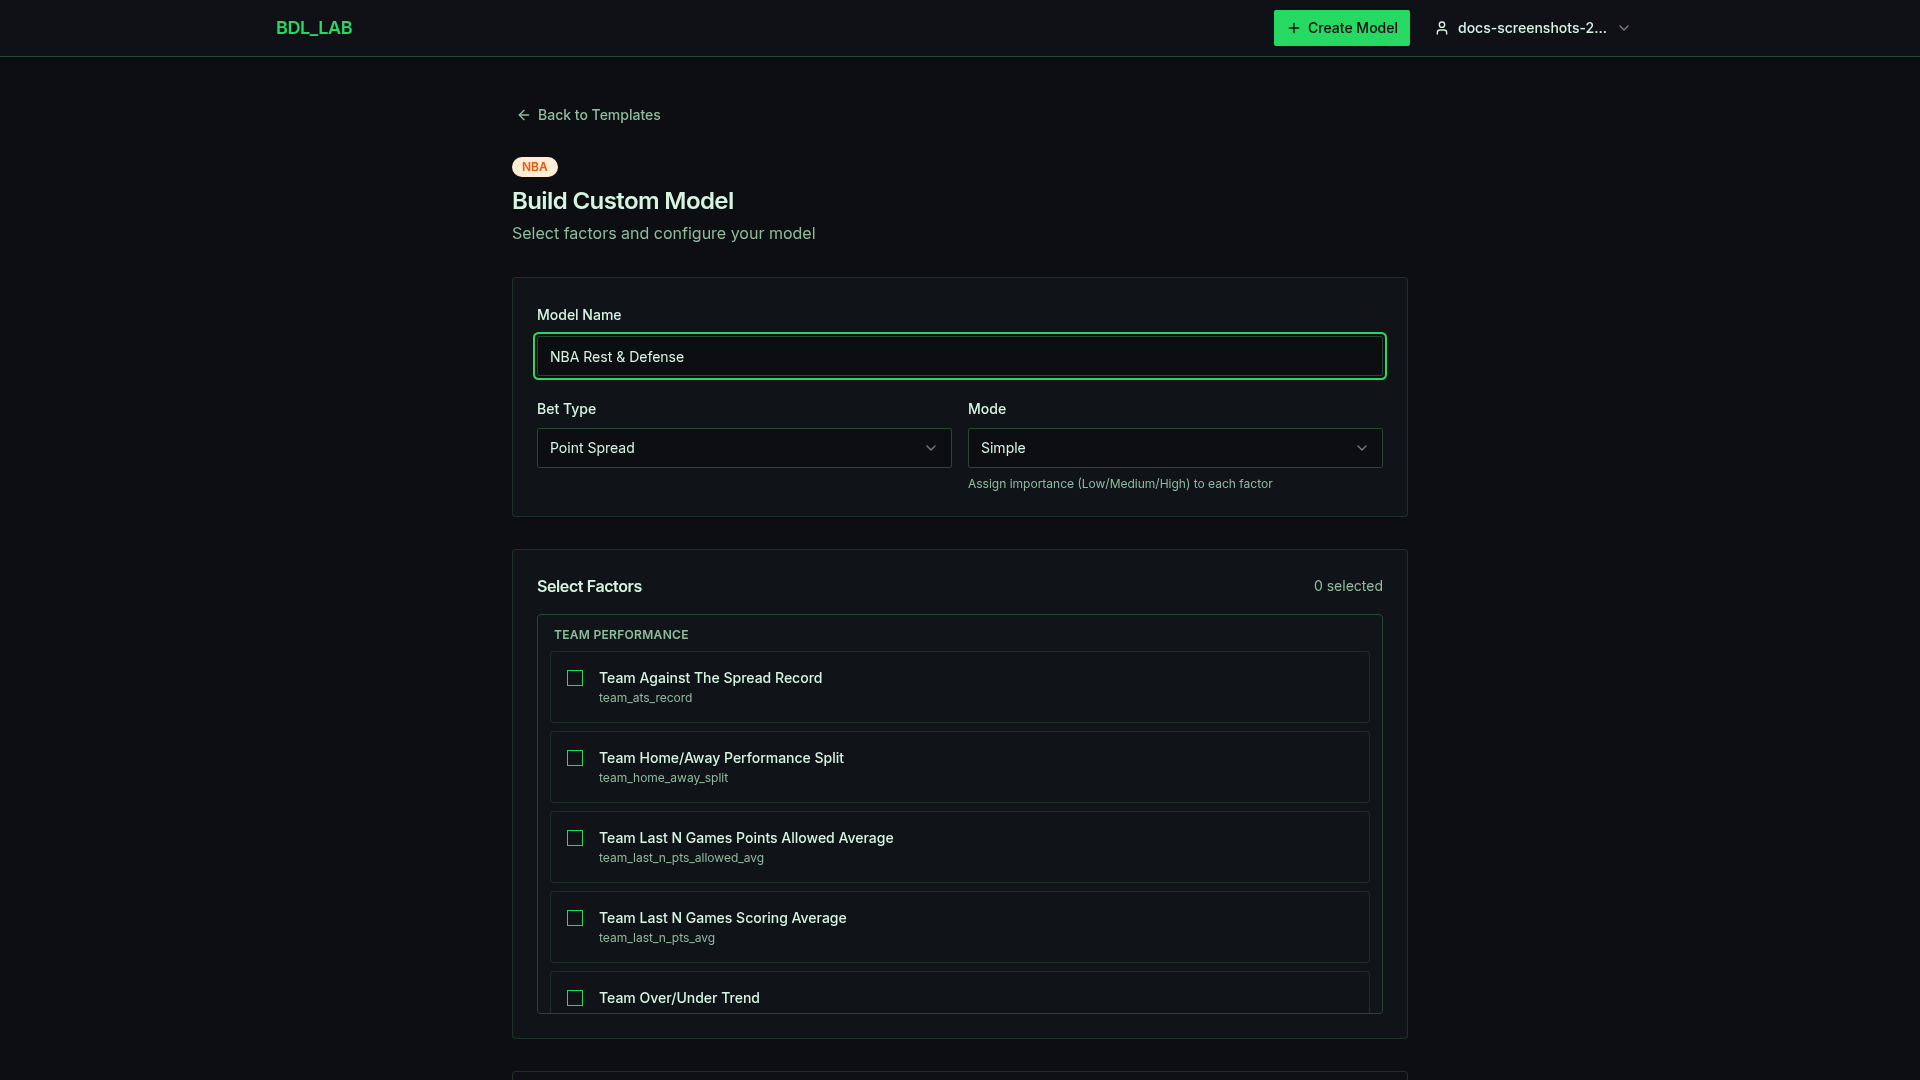 Configure your model name, bet type, and mode
Selecting Factors
We'll select 5 factors, chosen to complement each other without overlap:
team_last_n_pts_allowed_avgHigh ImportanceWhy: Defense travels. Teams allowing fewer points tend to keep games close, which matters for spread betting. This is our primary signal.
rest_daysHigh ImportanceWhy: Rest is one of the most predictive factors in the NBA. Teams on 0 rest (back-to-back) underperform by 2-3 points on average. This is especially valuable because oddsmakers sometimes underadjust.
back_to_backMedium ImportanceWhy: While rest_days captures the general rest advantage, this factor specifically penalizes the second game of a back-to-back. It complements rest_days by adding extra weight to the worst-case scenario.
team_ats_recordMedium ImportanceWhy: Teams that consistently cover the spread may have qualities (depth, coaching, clutch performance) not captured by other metrics. This is a "meta" factor that captures market inefficiency.
travel_contextLow ImportanceWhy: Extended road trips cause fatigue. We set this to Low because it's a secondary situational factor— important but less impactful than rest days.
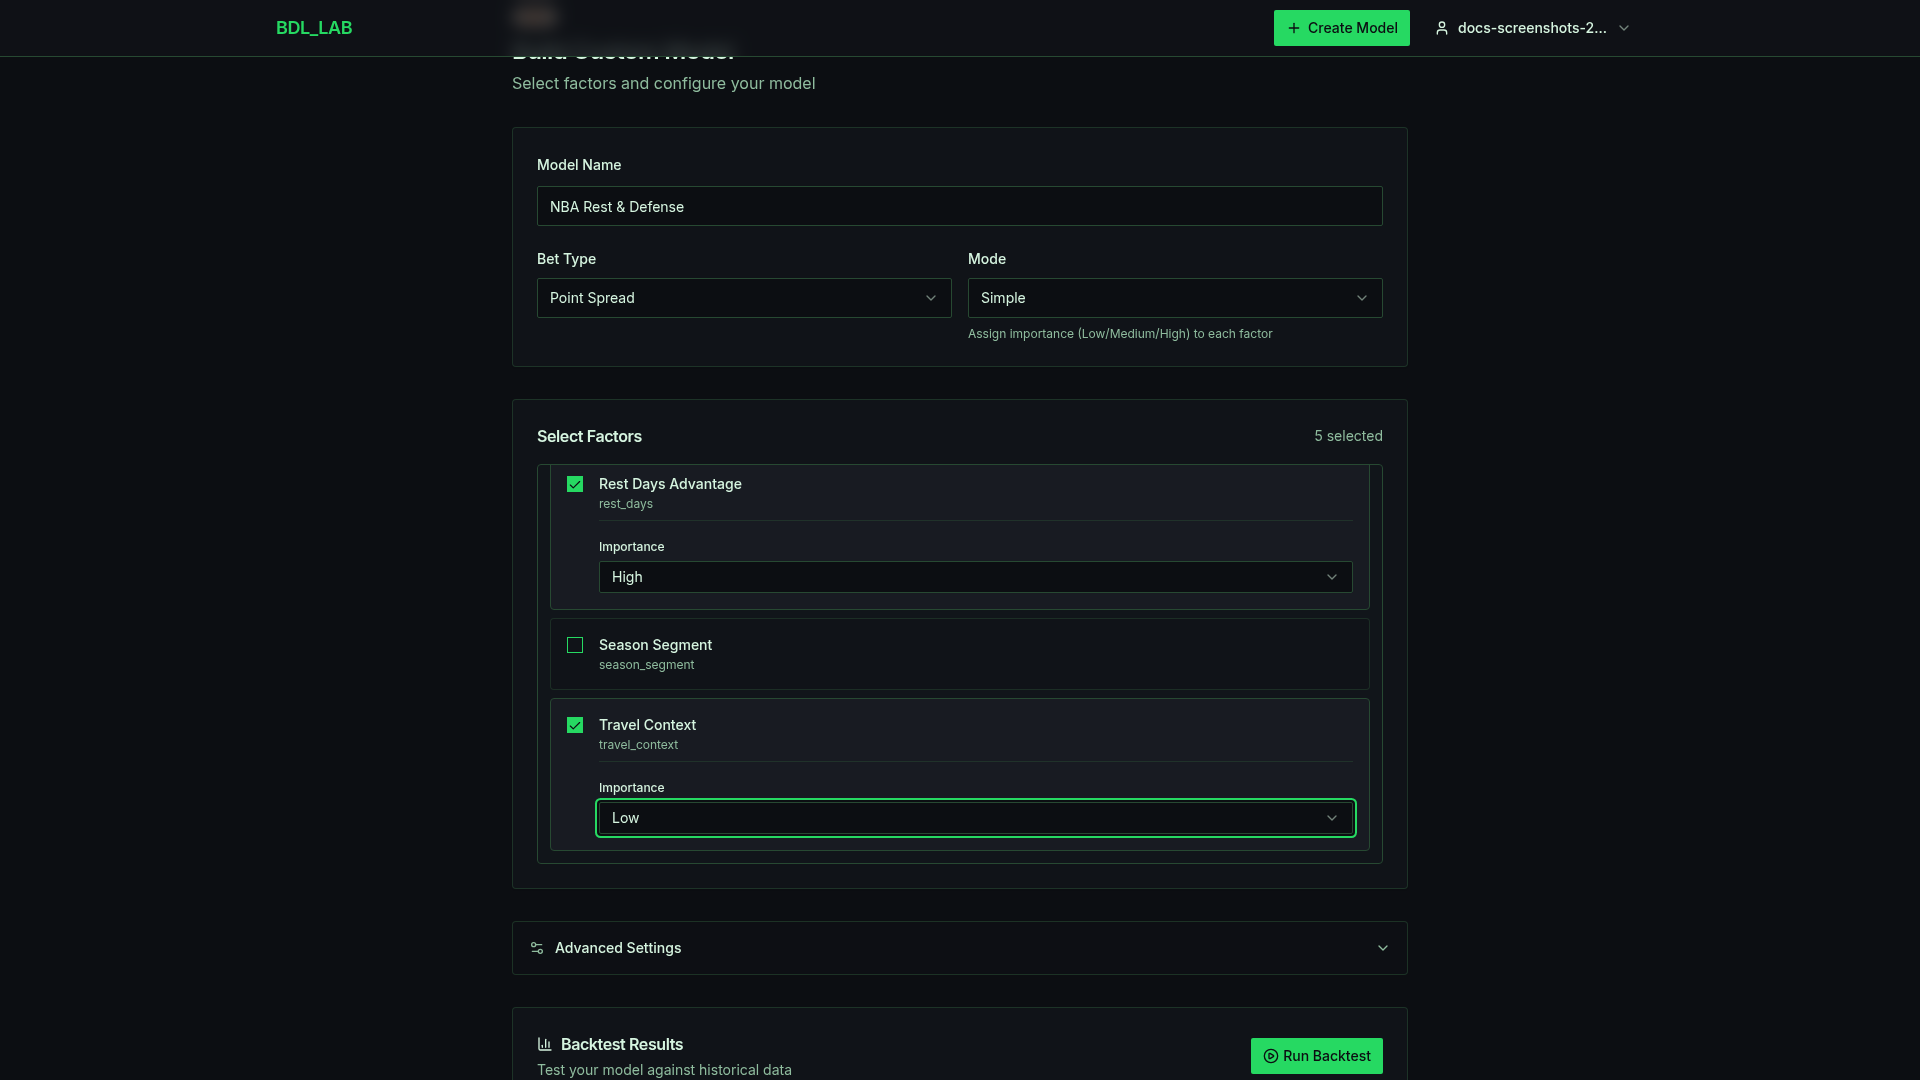 Select factors and assign importance levels
Configuration Summary
Model Name: NBA Rest & Defense
Sport: NBA
Bet Type: Point Spread
Mode: Simple

Factors:
  - team_last_n_pts_allowed_avg: HIGH (50)
  - rest_days:                   HIGH (50)
  - back_to_back:                MEDIUM (30)
  - team_ats_record:             MEDIUM (30)
  - travel_context:              LOW (10)

Total multiplier sum: 170
Effective weights:
  - team_last_n_pts_allowed_avg: 29.4%
  - rest_days:                   29.4%
  - back_to_back:                17.6%
  - team_ats_record:             17.6%
  - travel_context:              5.9%
Step 2: Run Preview
Before saving, click Run Preview to see how this model would have performed. The preview runs against all historical games with available odds.
 Preview results show historical performance before saving
Sample Preview Results
Historical Performance (2020-2024)
══════════════════════════════════
Total Games Analyzed: 4,892
Games with Predictions: 3,156 (64.5%)

Record: 1,672 - 1,412 - 72 (W-L-P)
Win Rate: 54.2%
ROI: +3.8%

Results by Confidence:
  Low (0-33):    512-498   (50.7%, +0.2% ROI)
  Medium (34-66): 724-612   (54.2%, +3.1% ROI)
  High (67-100):  436-302   (59.1%, +8.4% ROI)
How to Interpret Preview Results
Win Rate (54.2%):
- Against the spread, you need ~52.4% to break even (due to -110 vig)
- 54.2% is a solid edge—approximately +3.8% ROI assuming flat betting
- This means for every $100 wagered, you'd profit $3.80 on average
Results by Confidence:
- Low confidence (0-33): 50.7% is near break-even. These are games where the model has weak signal—consider skipping these.
- Medium confidence (34-66): 54.2% with +3.1% ROI. Decent edge but not overwhelming.
- High confidence (67-100): 59.1% with +8.4% ROI. This is where the model shines. The higher the confidence, the stronger the signal.
Games with Predictions (64.5%):
The model only predicts when the score differential exceeds the betting threshold (default: 5). 35.5% of games didn't meet this threshold—that's intentional. It's better to skip marginal games.
Key Insight: Focus on High Confidence
Step 3: Save and Backtest
If the preview looks good, click Save Model. Then click Run Backtestto persist the results.
 Your saved model with configuration summary
Evaluation provides the same metrics as preview, but the results are saved so you can track them over time. It also provides additional breakdowns:
- Monthly performance - See how the model performs in different months (playoffs vs regular season)
- Per-game details - Review individual predictions and outcomes
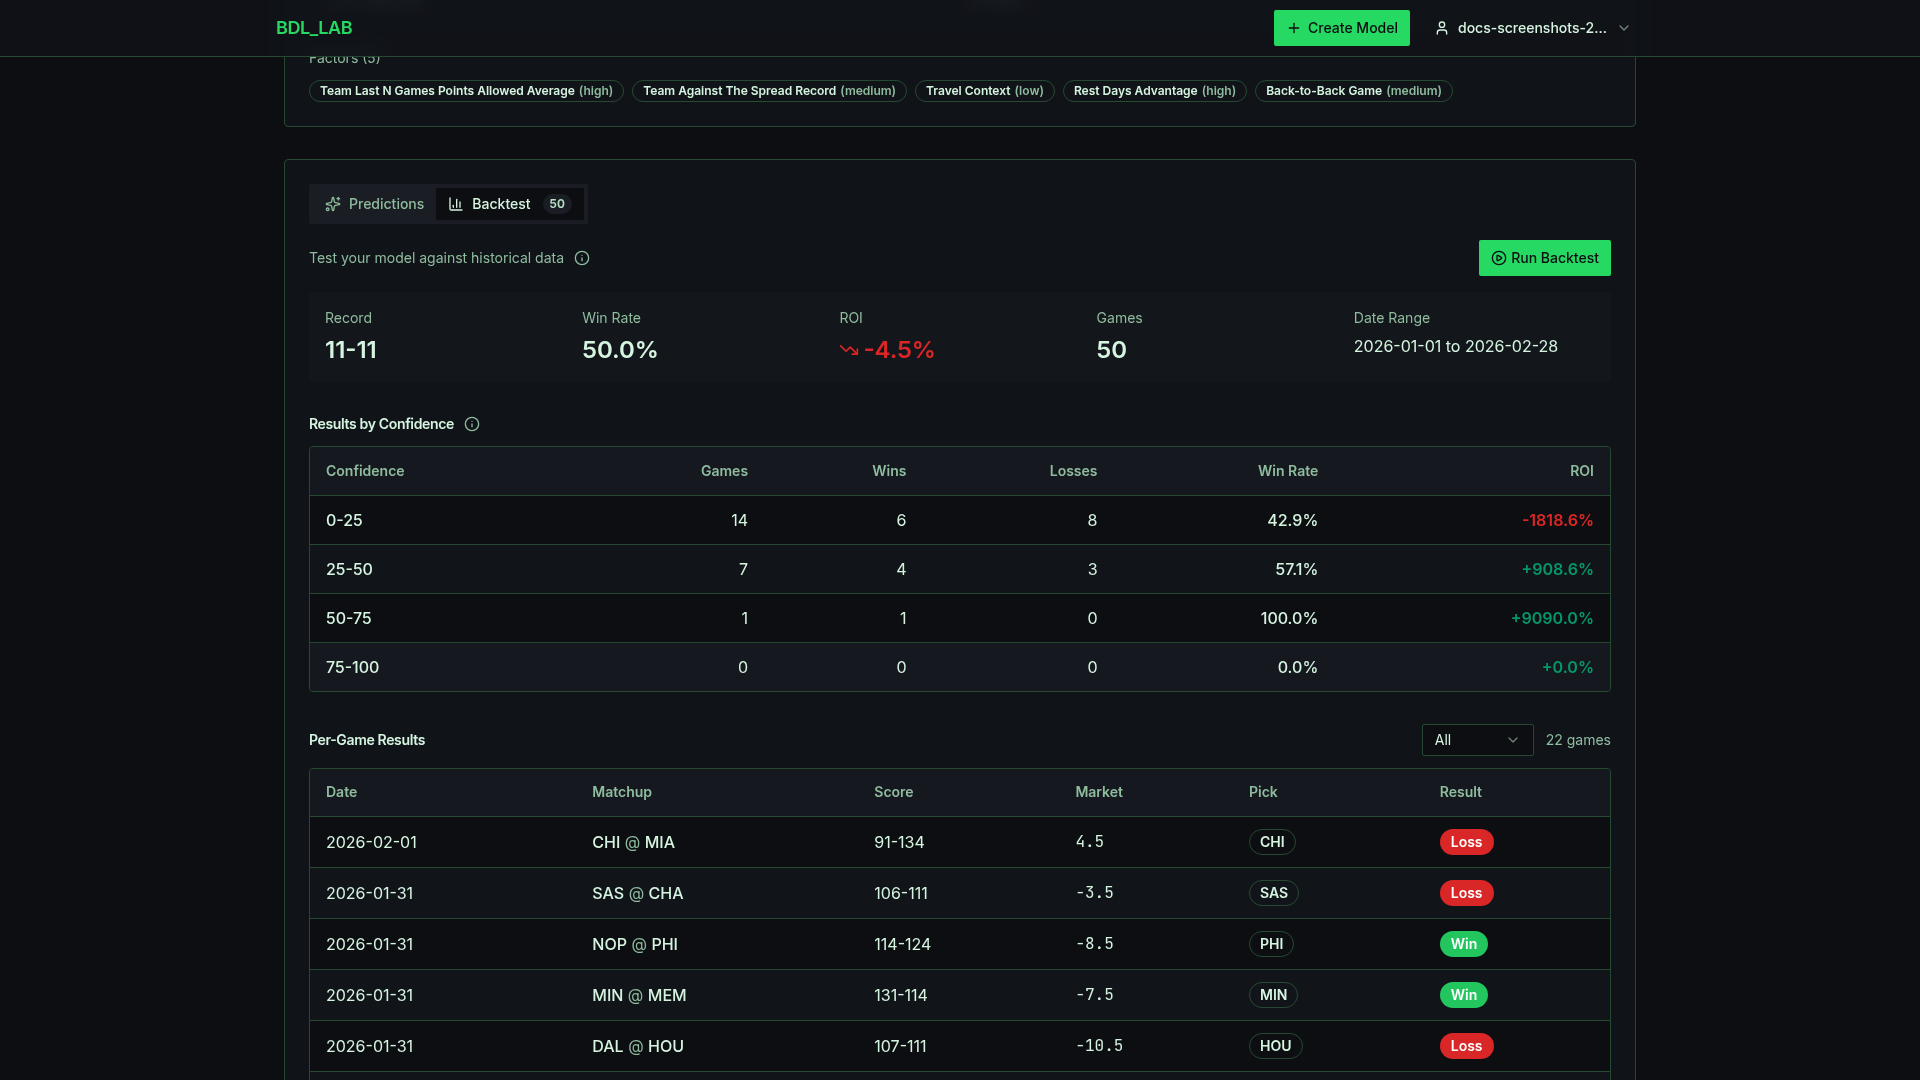 Evaluation results with confidence breakdown and per-game details
Sample Evaluation Detail View
Date       | Matchup              | Line  | Prediction | Confidence | Result
───────────┼──────────────────────┼───────┼────────────┼────────────┼────────
2024-01-15 | BOS @ MIA            | -4.5  | BOS -4.5   | 72         | WIN
2024-01-15 | LAL @ DEN            | +7    | DEN -7     | 58         | LOSS
2024-01-14 | PHX @ GSW (B2B)      | +3    | GSW -3     | 81         | WIN
2024-01-14 | MIL @ CLE            | +2.5  | CLE -2.5   | 45         | PUSH
2024-01-13 | NYK @ BKN            | -6    | NYK -6     | 63         | WIN
Reading the breakdown:
- Line - The opening spread. Negative = home favorite.
- Prediction - Which side the model recommends.
- Confidence - Score from 0-100. Higher = stronger signal.
- Result - WIN (covered), LOSS (didn't cover), or PUSH (exactly on the number).
Notice the PHX @ GSW game: Phoenix was on a back-to-back, GSW was well-rested, and our model correctly predicted Golden State to cover at home. The 81 confidence reflects the strong situational advantage.
Step 4: Generate Predictions
Click Generate Predictions to create predictions for upcoming games. The system calculates current factor values and applies your model weights.
 Predictions for upcoming games with confidence scores
Sample Predictions Output
Upcoming Games - January 20, 2025
═════════════════════════════════

Game: Boston Celtics @ Miami Heat
  Line: BOS -3.5
  Prediction: BOSTON -3.5
  Confidence: 67 (HIGH)

  Factor Breakdown:
    pts_allowed_avg: BOS 106.2 (score: 78) vs MIA 112.4 (score: 45)
    rest_days:       BOS 2 days (score: 70) vs MIA 1 day (score: 50)
    back_to_back:    Neither team
    ats_record:      BOS 58% (score: 58) vs MIA 48% (score: 48)
    travel_context:  BOS road trip game 2 (score: 45) vs MIA home (score: 65)

  Model Scores: BOS 65.2, MIA 51.4 (diff: +13.8)

─────────────────────────────────

Game: Los Angeles Lakers @ Denver Nuggets
  Line: LAL +6.5
  Prediction: DENVER -6.5
  Confidence: 74 (HIGH)

  Factor Breakdown:
    pts_allowed_avg: LAL 115.8 (score: 32) vs DEN 108.4 (score: 68)
    rest_days:       LAL 0 days (score: 20) vs DEN 2 days (score: 70)
    back_to_back:    LAL is B2B (score: 40 vs 60)
    ats_record:      LAL 45% (score: 45) vs DEN 55% (score: 55)
    travel_context:  LAL road trip game 4 (score: 35) vs DEN home (score: 65)

  Model Scores: DEN 63.8, LAL 34.4 (diff: +29.4)

─────────────────────────────────

Game: Phoenix Suns @ Golden State Warriors
  Line: PHX -1.5
  Prediction: NO BET
  Confidence: 12 (LOW)

  Note: Score differential (3.2) below threshold (5).
  Model doesn't have strong conviction on this game.
How to Interpret Predictions
Factor Breakdown:
Each factor shows the raw value and normalized score (0-100) for both teams. This helps you understand why the model is making a recommendation.
Model Scores:
The weighted sum of all factor scores for each team. The team with the higher score is predicted to cover. The difference determines confidence:
- Difference of 5-15: Low-Medium confidence
- Difference of 15-25: Medium-High confidence
- Difference of 25+: High confidence
NO BET Recommendations:
When the score differential is below your threshold (default: 5), the model outputs "NO BET". This is a feature, not a bug—it prevents you from betting on games with marginal edge.
Taking Action
Based on these predictions, here's a reasonable approach:
- Denver -6.5 (Confidence: 74) - Strong play. Lakers on B2B, extended road trip, weak defense. Denver well-rested at home.
- Boston -3.5 (Confidence: 67) - Good play. Celtics' elite defense and rest advantage offset road game.
- PHX/GSW (Confidence: 12) - Skip. No edge identified.
Step 5: Track Results
After games complete, return to your model to see updated results. The predictions page will show:
- Pending - Game hasn't started
- Win - Your prediction covered
- Loss - Your prediction didn't cover
- Push - Landed exactly on the number
Refining Your Model
After tracking results for a few weeks:
- If high-confidence picks outperform: Consider raising the betting threshold to only bet on 60+ confidence games
- If a factor isn't contributing: Try removing it or reducing its importance
- If you want more bets: Lower the threshold, but expect lower win rate
- To try new factors: Use Preview to test changes before saving
Advanced: Switching to Weighted Mode
Once you've validated your factor selection through backtesting, consider switching to Weighted Mode for precise control:
Based on our backtest, rest factors outperformed.
Adjusted weights:

  team_last_n_pts_allowed_avg: 25%
  rest_days:                   35%  (↑ from 29.4%)
  back_to_back:                20%  (↑ from 17.6%)
  team_ats_record:             15%  (↓ from 17.6%)
  travel_context:              5%   (unchanged)
                              ─────
                              100%
This gives you surgical precision over how the model weighs different inputs, allowing you to fine-tune based on what the backtest data reveals.
Factors System
Factor Categories
Each sport has factors organized into 5 categories, though the specific factors differ based on the sport's characteristics.
Team Performance
Measures how well a team has been playing recently. Examples include scoring averages, points allowed, and home/away performance splits.
Matchup
Analyzes the specific matchup between two teams. Includes head-to-head history and style matchups.
Situational
External factors that affect performance. Rest days, travel distance, back-to-back games, and schedule density all fall into this category.
Player
Accounts for individual player impact. Focuses on star player availability and their effect on team performance.
Score Calculation Methods
Raw factor values are converted to normalized scores (0-100) using one of these methods:
- League Percentile - Score based on ranking vs. all teams in the league (100 = best, 0 = worst)
- Linear Scale - Direct mapping from a defined range to 0-100
- Inverse Linear Scale - For factors where lower is better (e.g., points allowed)
- Boolean Scale - Binary factors converted to advantage/disadvantage scores
Configurable Parameters
Many factors have configurable parameters:
n_games- Number of recent games to consider (typically 3-30)home_only- Only include home games in calculationaway_only- Only include away games in calculationas_favorite/as_underdog- Filter by betting roleinclude_playoffs- Include playoff games in history
Factor Summary by Sport
| Sport | Team Perf | Matchup | Situational | Player | Player Props | Total |
|---|---|---|---|---|---|---|
| NBA | 5 | 4 | 5 | 3 | 11 | 28 |
| NFL | 6 | 4 | 4 | - | - | 14 |
| NHL | 6 | 3 | 4 | - | - | 13 |
| MLB | 5 | 3 | 5 | - | - | 13 |
NBA Factors (17)
Team Performance (5)
team_last_n_pts_avgTeam PerformanceAverage points scored by team in their last N games. Higher scoring indicates stronger offense.
team_last_n_pts_allowed_avgTeam PerformanceAverage points allowed by team in their last N games. Lower indicates better defense.
team_home_away_splitTeam PerformanceDifference in scoring margin between home and away games. Positive = better at home.
team_ats_recordTeam PerformanceWin percentage against the spread in recent games. 60%+ indicates consistent value.
team_over_under_trendTeam PerformancePercentage of games that went over the total. High = team tends to play high-scoring games.
Matchup (4)
head_to_head_recordMatchupWin percentage in recent matchups between the two teams. Historical dominance can persist.
head_to_head_atsMatchupAgainst the spread record in recent matchups between the two teams.
offensive_vs_defensive_ratingMatchupCompares team's offensive rating against opponent's defensive rating. Positive = favorable matchup.
pace_differentialMatchupDifference in pace between the two teams. Large difference can affect total prediction.
Situational (5)
rest_daysSituationalDays of rest before the game. More rest generally correlates with better performance.
back_to_backSituationalWhether this is the second game of a back-to-back. B2B teams typically underperform.
travel_contextSituationalWhether team is on a road trip, home stand, or transitioning. Extended road trips can cause fatigue.
season_segmentSituationalEarly, mid, or late season. Teams may perform differently at different points.
division_gameSituationalWhether this is a division matchup. Division games are often more competitive and unpredictable.
Player (3)
star_player_availabilityPlayerWhether key players are available. Injuries to stars significantly impact team performance.
player_last_n_avgPlayerA player's performance in their last N games vs season average. Hot/cold streaks matter.
player_vs_teamPlayerA player's historical performance against this specific opponent.
NBA Player Prop Factors (11)
Player Performance (5)
pp_season_avg_vs_linePlayer PerformanceCompares the player's season average for the stat to their prop line. A higher average relative to the line suggests the over.
pp_last_n_avgPlayer PerformancePlayer's average stat output over their last N games. Captures recent hot or cold streaks.
pp_consistencyPlayer PerformanceMeasures how consistently the player hits the stat line. Low variance players are more predictable.
pp_minutes_trendPlayer PerformanceTracks recent changes in playing time. More minutes generally correlates with higher stat output.
pp_usage_ratePlayer PerformanceHow frequently the player is involved in team possessions. Higher usage means more opportunities for stats.
Matchup (3)
pp_vs_opponentMatchupHow the player has performed against this specific opponent in recent matchups.
pp_opponent_defense_rankMatchupHow well the opponent defends against this stat type. Weaker defenses mean more opportunities.
pp_pace_impactMatchupExpected game pace based on both teams' tempo. Faster-paced games produce more counting stats.
Situational (2)
pp_home_away_splitSituationalDifference in player stat output at home vs away. Some players perform significantly better in one setting.
pp_rest_impactSituationalEffect of rest days on player performance. Well-rested players may perform better, but back-to-backs can lower output.
Market (1)
pp_line_vs_medianMarketCompares the current prop line to the player's median performance. Identifies when lines are set too high or too low.
NFL Factors (14)
Team Performance (6)
team_last_n_pts_avgTeam PerformanceAverage points scored by team in their last N games. Reflects recent offensive production.
team_last_n_pts_allowed_avgTeam PerformanceAverage points allowed by team in their last N games. Lower indicates better defense.
team_home_away_splitTeam PerformanceDifference in point differential between home and away games. Home field is significant in NFL.
team_ats_recordTeam PerformanceWin percentage against the spread in recent games. Consistent ATS teams offer value.
team_over_under_trendTeam PerformancePercentage of games that went over the total. Indicates team's game script tendencies.
yards_per_playTeam PerformanceTeam's offensive yards per play vs league average. Key efficiency metric.
Matchup (4)
head_to_head_recordMatchupWin percentage in recent matchups between the two teams. Rivalry games have patterns.
rush_vs_run_defenseMatchupCompares team's rushing yards per carry against opponent's rush defense.
pass_vs_pass_defenseMatchupCompares team's passing yards per attempt against opponent's pass defense.
turnover_differential_matchupMatchupCompares both teams' turnover differentials. Turnovers are the best predictor of outcomes.
Situational (4)
rest_daysSituationalDays of rest before the game. Short weeks (Thursday games) hurt teams significantly.
bye_week_advantageSituationalWhether team is coming off a bye week. Extra rest and preparation helps.
division_gameSituationalWhether this is a division matchup. Division games are often closer and more physical.
prime_time_performanceSituationalTeam's record in prime time games (SNF, MNF, TNF). Some teams thrive under the lights.
NHL Factors (13)
Team Performance (6)
team_last_n_goals_avgTeam PerformanceAverage goals scored by team in their last N games. Higher scoring indicates stronger offense.
team_last_n_goals_allowed_avgTeam PerformanceAverage goals allowed by team. Lower indicates better defense and goaltending.
team_home_away_splitTeam PerformanceDifference in goal differential between home and away. Home ice advantage is significant.
team_ats_recordTeam PerformanceWin percentage against the puckline in recent games.
team_over_under_trendTeam PerformancePercentage of games that went over the total. Useful for total predictions.
shots_on_goal_trendTeam PerformanceTeam's recent shots on goal vs season average. Higher SOG creates more scoring chances.
Matchup (3)
head_to_head_recordMatchupWin percentage in recent matchups. Historical dominance matters in rivalry games.
special_teams_matchupMatchupCompares team's power play efficiency against opponent's penalty kill.
goal_differential_matchupMatchupCompares both teams' recent goal differentials. Strong indicator of team quality.
Situational (4)
rest_daysSituationalDays of rest before the game. NHL teams often play back-to-backs with travel.
back_to_backSituationalWhether this is the second game of a B2B. B2B teams, especially goalies, often struggle.
travel_contextSituationalRoad trip length and travel distance. Extended road trips cause fatigue.
division_gameSituationalWhether this is a division matchup. Division games are chippy and often low-scoring.
MLB Factors (13)
Team Performance (5)
team_last_n_runs_avgTeam PerformanceAverage runs scored by team in their last N games. Reflects recent offensive production.
team_last_n_runs_allowed_avgTeam PerformanceAverage runs allowed. Reflects pitching and defense quality.
team_home_away_splitTeam PerformanceDifference in run differential between home and away games.
team_ats_recordTeam PerformanceWin percentage against the runline in recent games. MLB runline is typically -1.5.
team_over_under_trendTeam PerformancePercentage of games that went over the total.
Matchup (3)
head_to_head_recordMatchupWin percentage in recent matchups between the two teams (current season).
batting_vs_pitcher_handednessMatchupTeam's batting average against the starting pitcher's handedness (LHP/RHP).
bullpen_matchupMatchupCompares both teams' bullpen ERA and usage. Critical for close games and totals.
Situational (5)
rest_daysSituationalDays since team's last game. Back-to-back games are normal in MLB.
back_to_backSituationalWhether this is the second consecutive day playing. Normal in MLB but affects bullpen.
series_positionSituationalWhether this is game 1, 2, or 3+ of a series. Game 1 starters are typically aces.
division_gameSituationalWhether this is a division matchup. Division games are more competitive.
day_night_performanceSituationalTeam's record in day games vs night games. Some teams perform differently.
Building Models
Model Creation Flow
- Navigate to the Models page
- Click Create Model
- Enter a name for your model
- Select the sport (NBA, NFL, NHL, MLB)
- Choose the model type (Game Model or Player Prop)
- For player props: select the stat type (Points, Rebounds, Assists, Steals, Blocks, Threes)
- Choose the bet type (Spread, Moneyline, Over/Under, or Player Prop Over/Under)
- Select the mode (Simple or Weighted)
- Add factors from the available list
- Assign importance/weights to each factor
- Run a preview to test performance
- Save when satisfied
Simple Mode vs Weighted Mode
Simple Mode
Assign importance levels (Low, Medium, High) to each factor. The system converts these to weights using configurable multipliers:
- Low - Default multiplier: 10
- Medium - Default multiplier: 30
- High - Default multiplier: 50
The final weight is calculated as: factor_multiplier / sum_of_all_multipliers
Weighted Mode
Assign precise percentage weights to each factor. Weights must sum to exactly 100%. This mode gives you full control over how much each factor contributes to the final score.
Factor Selection Strategy
Tips for choosing factors:
- Diversify categories - Include factors from multiple categories to capture different aspects
- Consider the bet type - For Over/Under, focus on scoring and pace factors
- Start simple - Begin with 3-5 factors and add more as you understand their impact
- Use backtesting - Test different factor combinations to find what works
Backtesting
What is Backtesting?
Backtesting runs your model against historical games to see how it would have performed. The system calculates factor values using only data available before each game, simulating real-world conditions.
Data Availability
Free Tier Limitations
The free tier limits you to 1 model and 1 week of backtest data. Subscribe to LAB PRO or ALL-ACCESS for unlimited models and full historical access.
Backtest Configuration
- Season - Select a season to backtest against
- Team filters - Optionally limit to specific teams
- Confidence threshold - Minimum signal strength to place a bet
Understanding Results
- Record - Wins, losses, and pushes
- Win Rate - Percentage of bets won (excluding pushes)
- ROI - Return on investment assuming flat betting
- Results by Confidence - Performance broken down by signal strength
Performance Evaluation
Preview vs Backtest
| Feature | Preview | Backtest |
|---|---|---|
| Purpose | Test before saving | Full analysis after saving |
| Results Persisted | No (ephemeral) | Yes (stored in database) |
| Upcoming Predictions | Yes (preview only) | No (use Generate Predictions) |
What Evaluation Calculates
- Overall record (W/L/P)
- Win rate and ROI
- Average signal strength (confidence)
- Results by confidence bucket (Low/Medium/High)
- Results over time (monthly breakdown)
- Per-game breakdown with predictions
Invalidation
Manual Refresh Required
Backtests and evaluations do not update automatically. When new games are played or odds change, you need to manually re-run the evaluation to include the latest data.
Live Predictions
How Predictions Work
Predictions apply your model's factor weights to upcoming games. For each game, the system:
- Calculates factor values for both teams
- Computes weighted scores based on your model configuration
- Determines the predicted side (home, away, over, under)
- Assigns a confidence level based on score differential
For player prop models, predictions evaluate each player's upcoming prop lines. The system calculates factor values using the player's recent stats, opponent matchup data, and situational context to predict whether the stat line goes over or under the prop line.
Prediction Lifecycle
- Pending - Game has not started
- Win - Prediction was correct
- Loss - Prediction was incorrect
- Push - Result matched the line exactly
Manual Refresh Required
- You edit the model
- New games become available
- Opening lines are published
When to Regenerate
Run Generate Predictions:
- After editing model factors or weights
- When the schedule updates (new games added)
- Periodically to capture the latest factor values
Advanced Settings
Importance Multipliers (Simple Mode)
Customize how importance levels translate to weights. Default values:
| Level | Default Multiplier |
|---|---|
| Low | 10 |
| Medium | 30 |
| High | 50 |
Adjusting these changes the relative contribution of each importance level. For example, setting High to 100 makes high-importance factors contribute twice as much relative to the default.
Betting Thresholds
Control when to place a bet based on the model's score differential:
| Setting | Default | Description |
|---|---|---|
spread_score_diff | 5 | Bet home if home_score - away_score > threshold |
moneyline_score_diff | 5 | Same as spread threshold |
over_under_combined | 55 | Bet over if average combined score > threshold |
Tuning Strategies
- Lower thresholds - More bets, potentially lower edge per bet
- Higher thresholds - Fewer bets, higher conviction required
- Backtest different settings - Use preview to compare threshold configurations
Using with AI Agents
AI Agent Compatibility
The LAB API works great with AI agents like ChatGPT, Claude, and other LLM-powered tools. By providing the OpenAPI specification, AI agents can automatically understand and call the API.
Use Cases
- "Create a model focused on home team performance"
- "Run a backtest for my model and summarize the results"
- "Generate predictions for tonight's games"
- "Compare my models' performance over the last month"
- "Suggest factor combinations for NFL spread betting"
Getting Started with AI Agents
- Get your API key from the Settings page (requires LAB PRO or ALL-ACCESS)
- Share the OpenAPI spec URL with your AI agent:
https://lab.balldontlie.io/openapi.yaml - Describe what you want to do in natural language
Example Prompts
"Using the BDL LAB API, create a new NBA spread model
with factors for scoring average and rest days.
Set scoring average to high importance and rest days
to medium importance."
"Run a backtest on my model 'NFL Sharp' for the
2024 season. Summarize the results including win rate,
ROI, and performance by confidence level."
Tips for AI Agent Usage
- Be specific about sport, bet type, and factors
- Ask for summaries after running operations
- Use the agent to compare multiple configurations
- Have the agent explain factor choices and their impact